stoictrader

The Big Backtest Model

In Backtesting on January 19, 2014 at 3:25 pm

I’ve spent the last month putting together a big backtest model.  One Excel spreadsheet, with time series OHLC data and lots of different strategies in each column (long, short, exit, position size rules) including different iterations of each strategy, e.g. Strategy A, Fade Strategy A, Strategy A with a direction filter, Strategy A with a direction filter and position sizing, Strategy A with a direction filter and position sizing and pyramiding, Strategy B…

I can then load all sorts of data into the model: hourly, daily, weekly, multiple currencies, currencies and metals, equity indices, ETFs, etc.  Previously I had built models for one particular strategy or data series at a time which was interesting in isolation but difficult to compare across timeframes, across markets, and to other strategies.

After a month I now have a good working model with about 50 iterations of about 20 strategies.  Broadly the strategies fall into the following categories:

1. Trends – donchian, ATR stop trends, Chande Extraordinary Opportunity;

2. Candle Closes – long/short following a higher/lower close, long/short following a higher/lower close with a trend filter, follow two consecutive closes for third, fade 5+ closes in the same direction, etc;

3. Countertrend – fade envelope extremes, fade new high with a 1 day exit;

4. Moving Averages – single MA, double MA, price closing in reference to MAs, MA cross strategies, etc;

5. Buy and hold (long only no exits), Zero Hedge (short only, no exits), and Random – one of my favourites – a random number generator creates random buy signals 10% of the time and random sell signals 10% of time.

It’s been a fun process, not done yet, and I’m sure it will continue to evolve.  Maybe I’ll post some results or interesting observations.   (All of my limited free time has been going towards this which is why no weekly charts posts this year).

Have you got some ideas for strategies that I should add?  Do you backtest in Excel?  Shoot me an email or tweet or leave a comment.

– – –

Follow me on twitter: https://twitter.com/StoicTrader

– – -Anything below here is an unaffiliated advertisement – – –
GBPUSD Multiple Timeframe

In Charts on January 5, 2014 at 7:25 pm

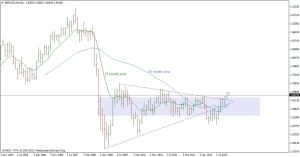
A look at GBPUSD in multiple timeframes from Monthly down to H4.  The uptrend looks good on the Daily/Weekly/Monthly charts, but rangey or downtrend on the shorter term 4-hourly chart which is worth keeping an eye on.

1. Monthly. Recent range breakout; and moving average cross (13ema, 50sma) appears to show uptrend. The last swing did not (?) make a lower low (but room for some interpretation there).

gbpusdmonthly

2. Weekly. Better detail here, but the recent move higher has been in a severe rising wedge which looks unsustainable to me.

2014 01 04 gbpusd w1

3. (Weekly) The 52-Week Donchian indicator has been ranging, but has recently broken the 52-week high and potentially started new uptrend.

gbpusdweeklydonch

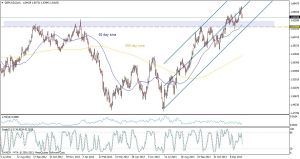
4. Daily. The Daily channel is holding, price is above 50 sma and 200 sma, and price is keeping to the middle or the channel; there is room within the channel for a retest of support at 1.63.

gbpusddaily

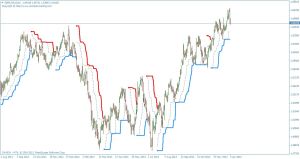
5. (Daily) The 20-Day Donchian indicator shows an uptrend that has been holding well since mid-2013. Room here for a retest of 1.63 as well.

gbpusddailydonch

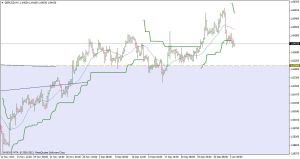
6. A 3.5 ATR stop on the H4 Chart shows rangey holiday trade (not unexpected) but started a downtrend in the first couple days of the year. Worth keeping an eye on, especially what happens around 1.63.  A re-start of an uptrend on the H4 chart could be a good long entry.

gbpusdh4

– – –

Follow me on twitter: https://twitter.com/StoicTrader

 – – -Anything below here is an unaffiliated advertisement – – –
EURGBP Multiple Timeframe

In Charts on January 5, 2014 at 2:29 pm

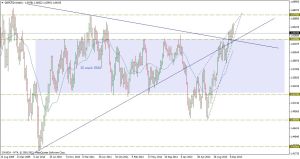
A look at EURGBP in multiple timeframes from Monthly down to H4.  The downtrend looks good in all timeframes and the shortest term 4-hourly chart is bearish as we start the trading year.   I will sell price spikes up towards 84 and watching for price confirmation below 81.

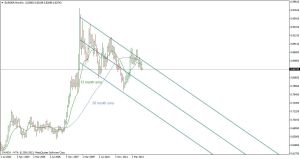
1. Monthly, Downtrend intact, the last swings were lower highs and lower lows, the moving averages are lined up and price is trading below. Price is near the upper channel and could be a good place to start a short position with good r/r depending on shorter timeframe entries.

eurgbpmonthly

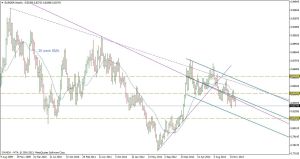
2. Weekly chart shows a shorter term channel where price is trading in the lower half; resistance at 84 would be a great short entry but watch for support at 81.

2014 01 04 eurgbp w1

3. (Weekly). A 52-Week Donchian indicator shows downtrends have been more successful lately, but is currently suggesting an uptrend, although price has been trading lower since the last switch.

eurgbpweeklydonch

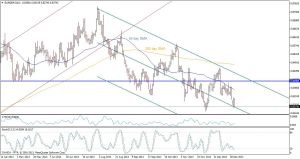
4. Daily chart shows price trading in a downtrend but near the middle of the channel, and below both the 50 and 200 day moving averages.  The key 84 level is still within the channel and could be tested again.

eurgbpdaily

5. (Daily). A 20-Day Donchian indicator shows downtrends have been slightly stronger lately, and a new downtrend was stated during the first few days of the year.

eurgbpdailydonch

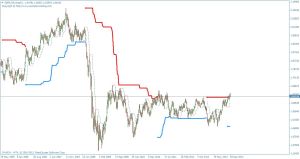
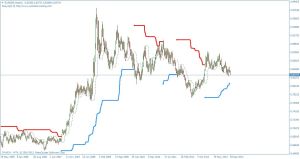
6. A 3.5 ATR Stop on the 4-Hourly chart shows price has been rangey during holiday trade, but is in a downtrend as we enter the first full week of  trading.

eurgbph4

– – –

Follow me on twitter: https://twitter.com/StoicTrader

 – – -Anything below here is an unaffiliated advertisement – – –